4 Types of User Experience Research for Ecommerce Conversion

Customer research for ecommerce stores is essential. Not only does it inform conversion optimization, it allows you to adjust your overall marketing and customer acquisition strategies.
By using traffic analytics to determine which traffic sources (especially PPC and ad traffic) lead to most conversions, you can gauge the efficiency of your acquisition strategy. That way, you can double down on the channels that bring in better-converting customers, and adjust targeting or discontinue the campaigns that have low conversion results or attract less traffic.
Using your customer research, you can create personas to foster the personalization of your website. The more you know about your customers, the more accurate your personas will be — and the more effective both your personalization and traffic acquisition will become.
The first step in improving something is knowing how good (or bad) it is right now. That way, you can compare your improved results to your existing performance.
The first step in improving something is knowing how good (or bad) it is right now.
Thus, the CRO process should begin by establishing a baseline measurement, which you can do using web analytics tools. Regardless of which tool you choose, it will serve a dual purpose:
Establish that baseline measurement of current performance
Observe what visitors do on your website when they reach it
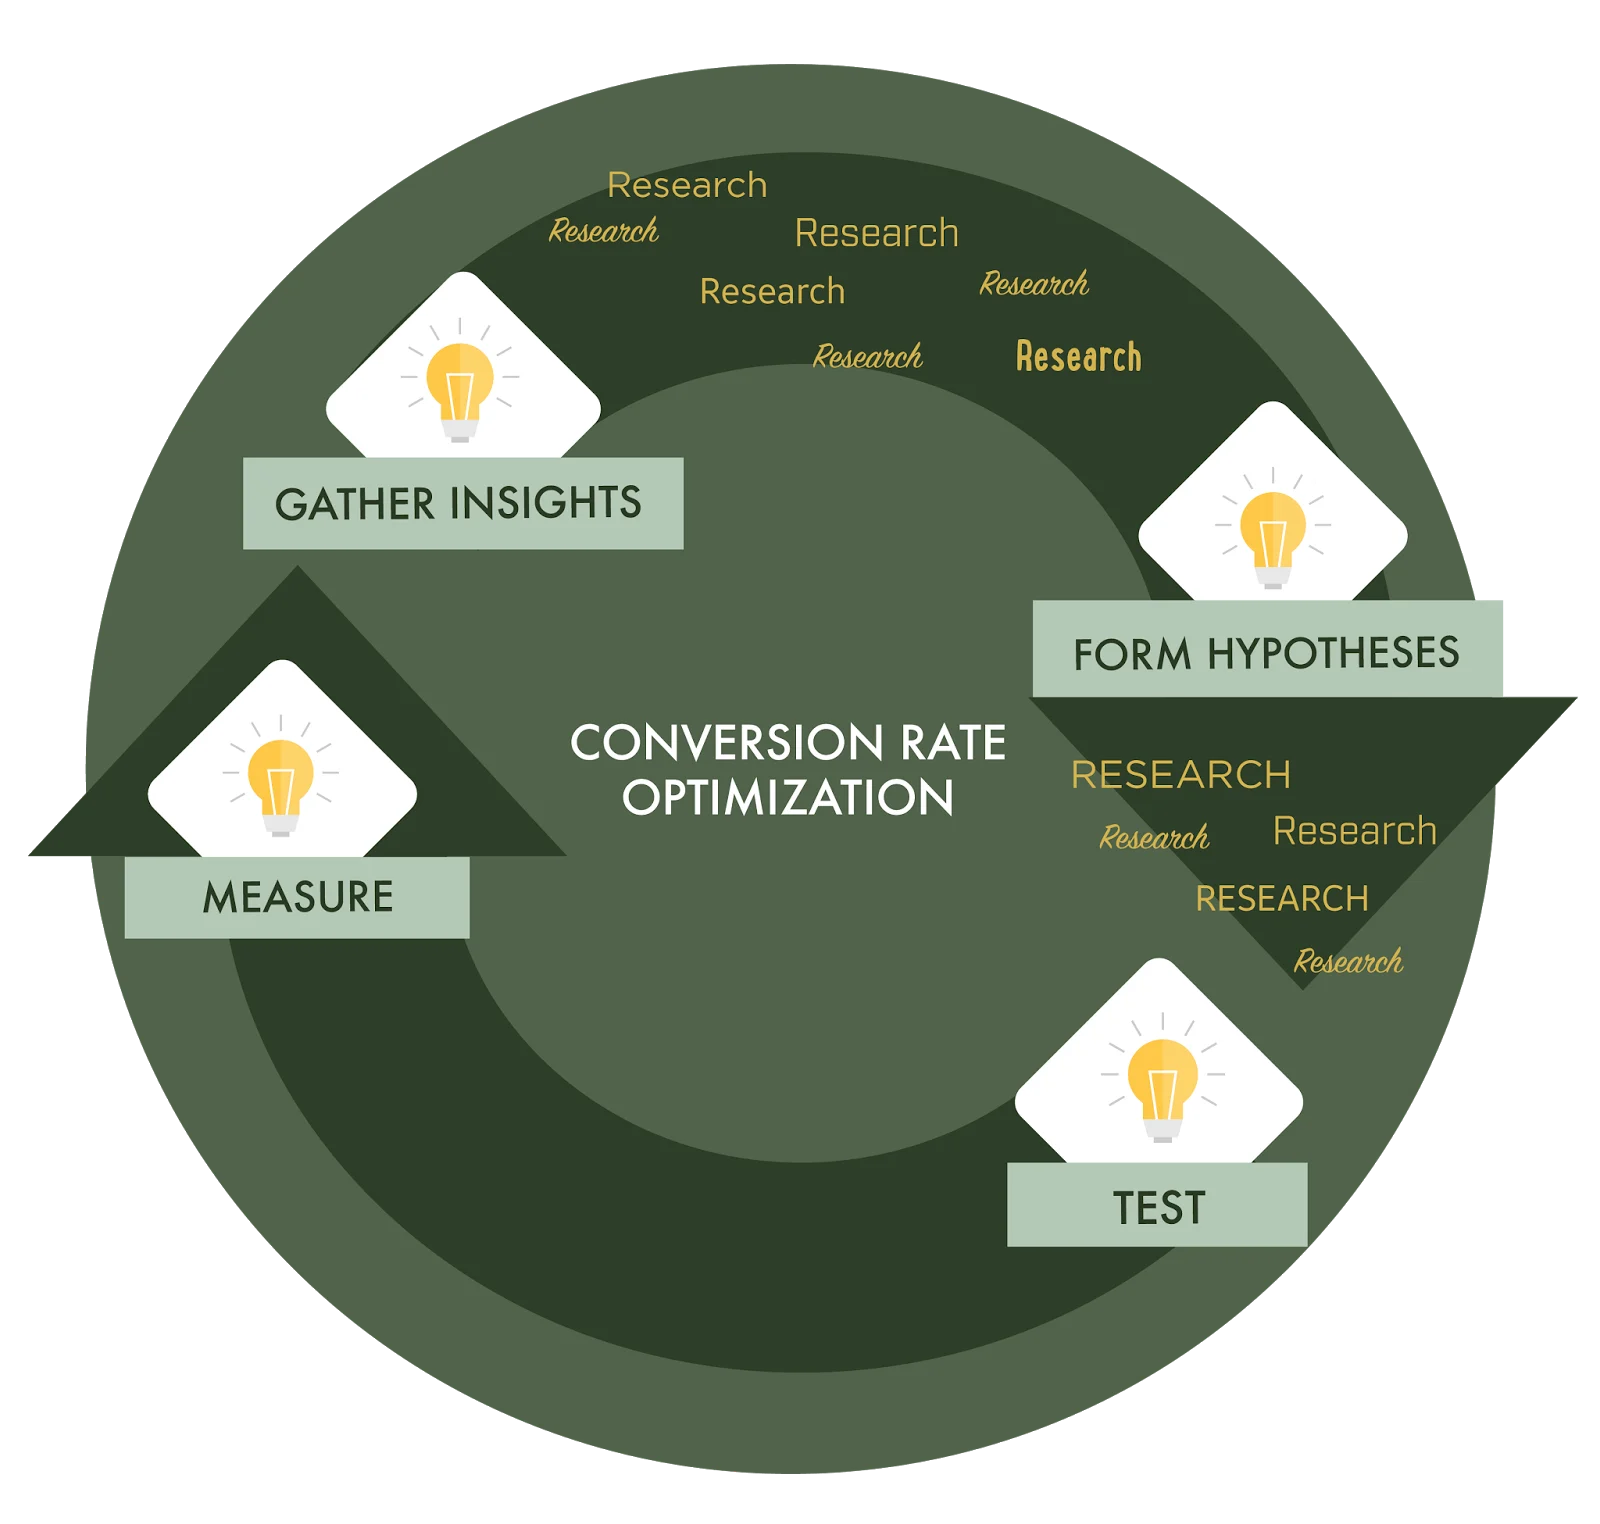
After you’ve documented your baseline, it is time to start your research and identify the obstacles your visitors need to overcome to become customers. Reducing or removing these obstacles is the only way to make your visitors convert instead of leaving your website.
To summarize: before we can eliminate conversion obstacles, we need to identify them, and in order to identify them, we need to do research — on how customers are interacting with your store. In order for the process to go smoothly, it is necessary to define the primary objectives and metrics to improve before you begin.
Your goals will depend primarily on the nature of your business, but sales are often the best indicator of success. You can also identify supporting indicators, such as engagement, lead contact forms filled, or number of promotional videos viewed, for example.
Steps to determine your objectives:
Find macro-conversion metric
Identify and define micro-conversion metrics, such as newsletter subscriptions, etc.
Define user engagement indicators and their correlation with macro- and micro-conversions
The 4 Types of User Experience Research for CRO
The process of conversion optimization consists of four distinct types of research:
Technical issues
Usability issues
Behavior-related issues
Website content issues
Each aims to identify different types of obstacles. The aim is that by covering all your research bases, you can identify and solve every issue stopping visitors from converting.

1. Technical issues
Identifying technical issues is the most straightforward part of research. Technical problems, if they exist, are easy to detect and comparatively easy to fix. They’re always objective problems that make the website hard or impossible to load correctly.
For example, a certain browser may have difficulty displaying your website. Visitors using this browser won’t be able to convert for the simple reason that they cannot see your website.
Fixing this problem and other technical issues (such as mobile responsiveness, site speed, broken links, and erroneous code) should be your first priority, as these problems adversely affect visitors.
Common ways to identify technical issues range from using analytics to observe the behavior of visitors using different devices, browsers, and screen resolutions, to employing dedicated tools like Screaming Frog, a tool that crawls websites to uncover broken links, erroneous code, and other potential technical problems.
Your technical audit should include these checks:
Check for site function on different browsers, screen resolutions, and devices
Check for broken links
Check for code issues
Check for website speed issues
2. Quantitative research
Quantitative research aims to obtain exact numerical indicators of your website’s performance. By using various analytical tools (such as BigCommerce Ecommerce Analytics or Google Analytics, heat maps, mouse-tracking, form-tracking, etc.), quantitative analysis gathers aggregate data about:
what visitors do on the site
where they come from
how they perform in terms of conversion and engagement
The most important step prior to starting this research is to decide which metrics and indicators you care about most. When you know this, it is possible to structure the data-gathering process so that you receive accurate and timely measurements of the metrics that matter most to your business.
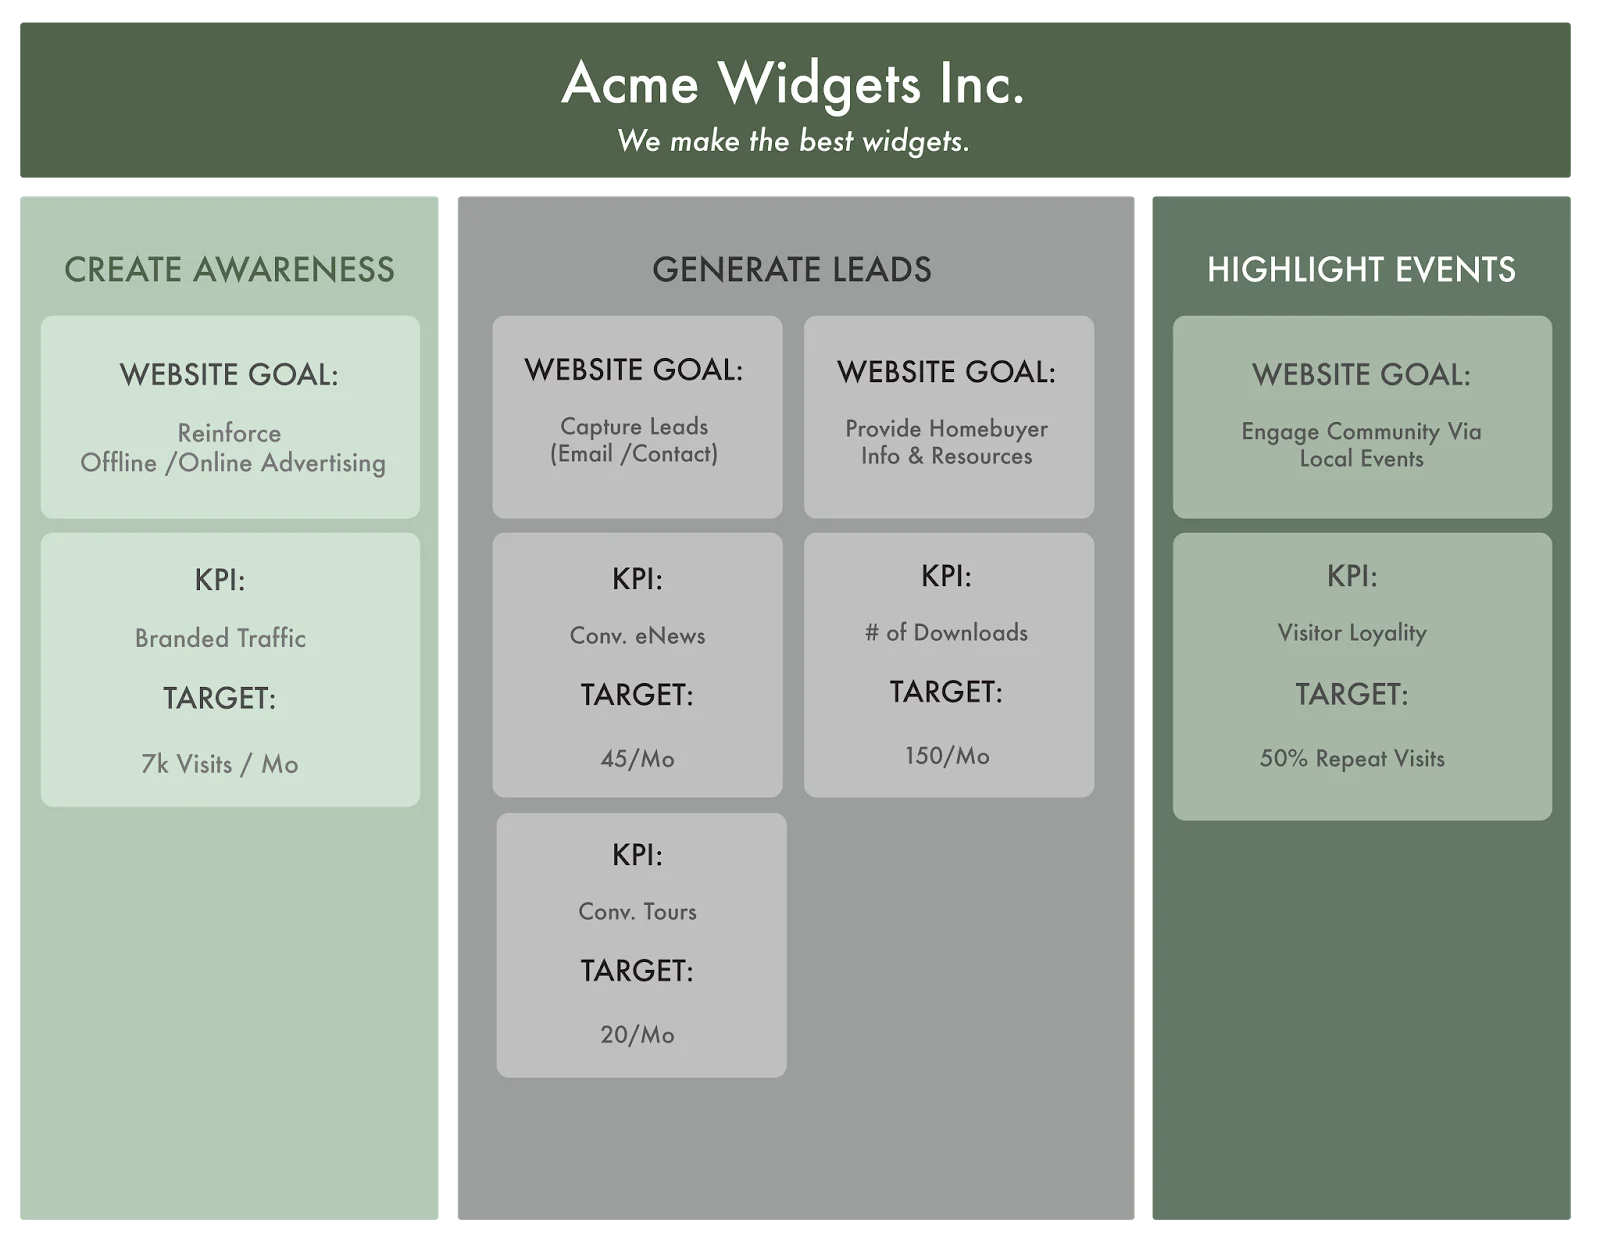
In fact, before you start measuring anything, you must create a measurement plan. A measurement plan consists of key performance indicators (KPIs), and describes how they work toward overall business goals.
What are KPIs?
KPIs are measurements that best reflect the success of a website. Determining the proper KPIs requires detailed knowledge of the business, the relationship between individual processes, and the actions customers take.
To qualify as a KPI, a metric must be positively correlated with the final macro-objective, which in the case of virtually all ecommerce sites is a product purchase.
For example: your sales department may inform you that 40% of all customers who fill out the lead form will eventually purchase a product. That means increasing the number of people who fill out the form will have a direct, positive impact on the end result.
Therefore, the number of people who fill out the form is a KPI.
Identifying these correlations, quantifying them, and setting up a workflow to track them is the primary aim of a measurement plan.
This allows you to not only measure accurately, but to plan improvements and prioritize them according to the scale of their individual impact on the final result.

An example workflow showing a measurement plan
The main use of quantitative data is to enable visualization and pattern recognition of visitor behavior. This enables you to form hypotheses based on the behavior of specific groups of visitors.
For example, knowing that a specific gender or age group behaves differently and converts below the site average indicates that you may be able to increase the conversion rate of this group simply by addressing their specific needs in your next round of site improvements.
The main use of quantitative data is to enable visualization and pattern recognition of visitor behavior.
Furthermore, quantitative indicators are indispensable in establishing baseline performance. This makes quantitative research second only to technical analysis in your setup priorities.
Finally, quantitative data can be used to underpin and confirm the findings of the other three types of research. For example, technical issues with sections of your website can be confirmed by quantitative data, and prioritized relative to how many visitors are impacted by those issues.
All of the above indicates how important a role quantitative research plays in both overall conversion optimization and the everyday operation of your website.
Using quantitative tools, you should examine:
Indicators of popularity of the website content (bounce rate, session duration)
Conversion rate
Average order value
Popular products and product categories
Least popular products and product categories
Efficiency of traffic acquisition channels
Behavior of different segments of visitors (by gender, language, devices, new vs. returning, etc.)
3. Heuristic analysis
While a website is a technical construct, its purpose is to help humans successfully accomplish the tasks or goals they want to achieve.
A website can be technically sound and still fail to help users achieve their purpose.
A website can be technically sound and still fail to help users achieve their purpose. Often, the primary cause is an issue in the user interface (UI) or overall user experience (UX) of the website.

Interface and user experience play an important role in converting visitors to customers. An enjoyable user experience, on a website that makes navigation and goal achievement easy and smooth, engenders trust and liking in your visitors.
What is a heuristic analysis?
Heuristic analysis of a website aims to improve a website’s user interface by eliminating any elements that make the user experience harder or less intuitive.

The Nielsen-Norman Group defined 10 universal heuristics for human-machine interface, which represent the gold standard of interface design.
The most common characteristics of a well-designed site from a user experience perspective are:
Functionality
Simple and organized layout
Consistency
An important part of heuristics refers to “recognition over recall” — this means that instead of a system asking the visitor to remember how to operate it, the system itself should recognize the visitor and serve them the content they prefer, in a way they want.
This concept ties into website personalization, a concept that has emerged as one of the best ways to increase conversions.
As an example of how personalization can influence a website and conversions, a study conducted by Monetate found that geo-location-based personalization increased conversions 100% across the board. And this was using only the simplest of personalization techniques.
Heuristic research’s main contribution to conversion optimization lies in uncovering the main opportunities for personalization and defining how they can be achieved.
This research is usually done by using a checklist to confirm that design best practices are observed; conducting user testing to see what obstacles real visitors encounter while navigating the site; and documenting the experience of the researchers themselves.
Heuristics should primarily address these questions:
Can visitors navigate the website and find what they want quickly, easily, and effortlessly?
Does the website look relevant and clear according to the five-second test?
Is the call to action clear?
Can the customer complete the purchase process without unnecessary friction (ex. overly long forms, multiple redundant steps)?
How are user errors processed and reported?
4. Qualitative research
The last, but not least, part of conversion optimization research is what is commonly referred to as qualitative research. It deals specifically with users’ perceptions of a website.
Optimizing a website is impossible without taking into account the most important ingredient of all: the visitors and customers who use it to achieve their goal or solve their problem.
The objective of this phase of research is to determine what visitors think about the content of the site.
Do they trust it?
What stops them from converting?
What are their major issues with the website?
In addition, qualitative research serves to gather as much data about the website audience in order to further improve personalization and better address the target audience.
Where other parts of the research process may tell us what and how users do what they do on a website, only qualitative research can uncover why. And knowing the answer to ‘“the why” question is frequently all that is needed to drastically improve the performance of a website.
Qualitative research is usually what fuels different hypotheses. Customer feedback can be used to:
Identify who your customers are (both generally and individually)
Identify what they want (shared common goals)
Identify what bothers them (areas of friction)
Even when you thoroughly address all four components of the research process, the research phase is not yet complete. The final result of the research is to create a list of hypotheses –– which we’ll discuss in the next chapter.

Edin Šabanović is a senior CRO consultant working for Objeqt. He helps e-commerce stores improve their conversion rates through analytics, scientific research, and A/B testing. Edin is passionate about analytics and conversion rate optimization, but for fun, he likes reading history books. He can help you grow your ecommerce business using Objeqt’s tailored, data-driven CRO methodology. Get in touch if you want someone to take care of your CRO efforts.


